Essay
The following graph shows the demand and supply for i-Pods. 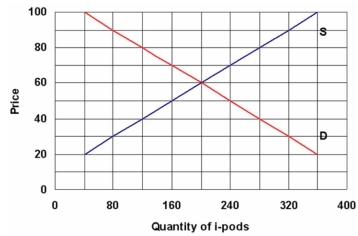 a) What is equilibrium price and quantity?
b) Suppose that a $20 per unit sales tax is placed on the product. Draw in the new supply curve labeled Stax.
c) What is the new equilibrium price and quantity?
d) What proportion of the tax is paid by the consumer, and what proportion is paid by the seller in this case?
Correct Answer:

Verified
a) $60 and 200
b) Se...View Answer
Unlock this answer now
Get Access to more Verified Answers free of charge
Correct Answer:
Verified
b) Se...
View Answer
Unlock this answer now
Get Access to more Verified Answers free of charge
Q9: The list below refers to the price
Q54: Suppose that average incomes decreased from $38,000
Q60: What is income elasticity?<br>A)The change in the
Q71: <img src="https://d2lvgg3v3hfg70.cloudfront.net/TB5692/.jpg" alt=" -Refer to the
Q108: Below are some data on price,income and
Q115: The graph below shows the supply and
Q122: What do products such as household electricity,tobacco
Q139: The list below refers to the price
Q158: How can income elasticity be used to
Q177: <img src="https://d2lvgg3v3hfg70.cloudfront.net/TB5692/.jpg" alt=" -Refer to the