Multiple Choice
Below is a production possibilities curve involving tea and videos.
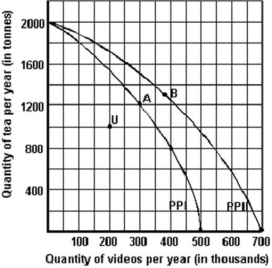
-Refer to the graph above to answer this question.What might point U indicate?
A) Not all resources available to the economy are being used.
B) The resources being used are not being used efficiently.
C) The technology being used is not the most appropriate one.
D) All of these.
Correct Answer:

Verified
Correct Answer:
Verified
Q142: The following table shows the production possibilities
Q143: What is an example of an economic
Q144: Below are some production possibilities data for
Q145: Discuss the pros and cons of economic
Q146: Which of the following statements describes the
Q148: The maximum production possible in Rome and
Q149: All of the following statements,except one,are positive
Q150: Which of the following is a consumer
Q151: Technological improvement can be illustrated graphically by
Q152: Below are some production possibilities data for