Essay
The following graph shows the production possibilities for the economy of Esher: 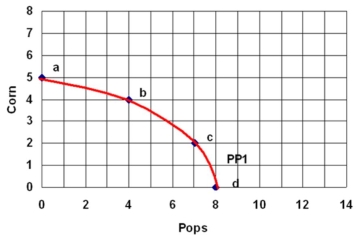 a) What is the total cost of producing 7 pops?
b) What is the total cost of producing 4 corns?
c) What is the cost of moving from point b to point c?
Suppose that Esher experiences a 50% increase in the productivity of producing Pops.
d) Draw in the new production possibilities curve labelled PP2.
e) If Esher wants to have 6 pops, how many corn can it now have?
Correct Answer:

Verified
a) 3 corn
b) 4 pops
...View Answer
Unlock this answer now
Get Access to more Verified Answers free of charge
Correct Answer:
Verified
b) 4 pops
...
View Answer
Unlock this answer now
Get Access to more Verified Answers free of charge
Q4: Tigris produces only two products: tennis
Q4: Below is a production possibilities curve for
Q10: Below are some production possibilities data
Q12: Given the following production possibility curve.
Q46: Which of the following terms describes the
Q56: What do economists always do when they
Q72: Discuss the pros and cons of taking
Q114: The cost of getting a degree (tuition
Q118: Why is economics relevant?
Q147: Below is a production possibilities curve involving