Multiple Choice
The graph below shows how yield in two varieties of corn respond to different environmental conditions. 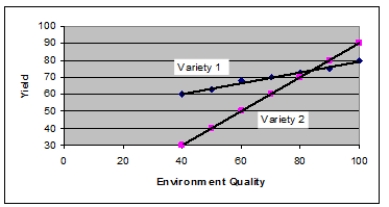 Which of the following statements is TRUE?
A) Under tested conditions, variety 1 has a higher yield than variety 2.
B) Under tested conditions, variety 2 has a higher yield than variety 1.
C) Under tested conditions, variety 2 is more sensitive to environment quality than variety 1.
D) Variety 1 is genetically superior to variety 2.
E) Variety 2 is genetically superior to variety 1.
Correct Answer:

Verified
Correct Answer:
Verified
Q56: _ is a way to measure the
Q57: Phenotypic variation in tail length of
Q58: Use the following to answer questions <br>The
Q59: Two varieties-X (susceptible) and Y (resistant)-of eggplant
Q60: Use the following to answer questions <br>The
Q62: Two varieties-X (susceptible) and Y (resistant)-of eggplant
Q63: _ can cause a single genotype to
Q64: Do the principles discovered by Mendel for
Q65: Use the following to answer questions
Q66: You are hired as a consultant for