Not Answered
The dotted line in the following graph shows levels of glucose in a culture of wild-type E. coli grown in Moderate that initially contains both glucose and lactose. The solid line shows levels of transcription of the lac operon. Describe what is happening to the culture and the lac operon, referring to the lac repressor, allolactose, cAMP, and CAP (catabolite activator protein). 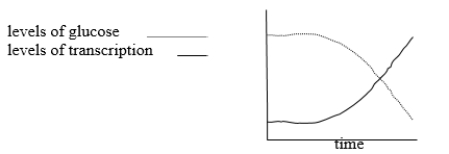
Correct Answer:

Verified
Correct Answer:
Verified
Q42: Which of the following types of eukaryotic
Q43: What is the function of cAMP in
Q44: In the presence of both lactose and
Q45: The trp operon is known to operate
Q46: Draw a diagram of the transcription and
Q48: A mutant E. coli strain is
Q49: An operon is controlled by a repressor.
Q50: The following table shows several bacterial
Q51: When binding of the inducer to the
Q52: Aside from the case of lacO<sup>c</sup>, where