Multiple Choice
From the TI- 84 graphing calculator screenshots below, choose the screenshot whose shaded area depicts a p- value for a left- tailed test.
A) 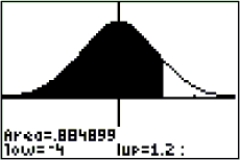
B) 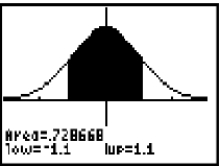
C) 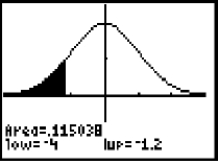
Correct Answer:

Verified
Correct Answer:
Verified
Related Questions
Q3: The worker at a carnival game claims
Q4: Use the following information to answer the
Q6: Use the following information to answer the
Q8: Use the following information to answer the
Q9: Read the following then choose the appropriate
Q10: Use the following information to answer the
Q12: For the following description, state whether a
Q21: List and verify that the conditions hold
Q25: Based on a 5% significance level, write
Q47: A researcher wishes to test the claim