Multiple Choice
From the TI- 84 graphing calculator screenshots below, choose the screenshot whose shaded area correctly depicts the following hypothesis test results: H0: p = 0.15, Ha: p × 0.15, a = 0.05, z = - 1.82, p- value = 0.0688
A) 
B) 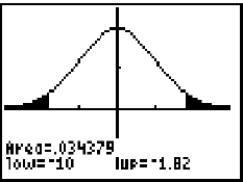
C) 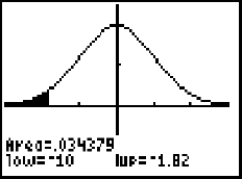
Correct Answer:

Verified
Correct Answer:
Verified
Related Questions
Q28: When a two-sample test of proportions is
Q30: Use the following information to answer the
Q31: Which statement best describes the significance level
Q32: List and briefly summarize the essential ingredients
Q33: A polling agency is interested in testing
Q34: Complete the statement by filling in the
Q37: Use the following information to answer the
Q38: Use the following information to answer the
Q39: Use the following information to answer the
Q40: Suppose a city official conducts a hypothesis