Multiple Choice
From the TI- 84 graphing calculator screenshots below, choose the screenshot whose shaded area correctly depicts the following hypothesis test results: H0: p = 0.25, Ha: p > 0.25, a = 0.05, z = 2.01, p- value = 0.022
A) 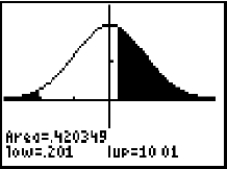
B) 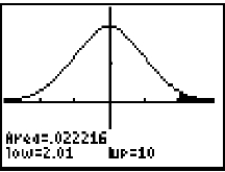
C) 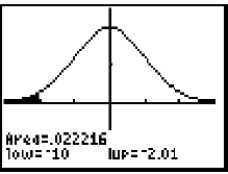
Correct Answer:

Verified
Correct Answer:
Verified
Related Questions
Q23: Use the following information to answer the
Q24: A researcher conducts a hypothesis test on
Q25: A research firm carried out a hypothesis
Q26: Suppose a city official conducts a hypothesis
Q27: Suppose the following is to be tested:
Q29: A sociologist believes that families that eat
Q30: Use the following information to answer the
Q31: Which statement best describes the significance level
Q32: List and briefly summarize the essential ingredients
Q33: A polling agency is interested in testing