Multiple Choice
The scatterplot below shows the hat size and IQ of some adults. Is the trend positive, negative, or near zero? 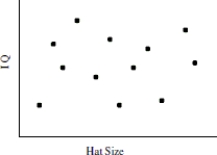
A) Negative
B) Positive
C) Near Zero
Correct Answer:

Verified
Correct Answer:
Verified
Related Questions
Q35: Use the regression equation to predict how
Q36: Use the following information to answer the
Q37: The data in the table represent the
Q38: The following model was created to show
Q39: Use the following information to answer the
Q41: Suppose it has been established that "annual
Q42: Use the following information to answer the
Q43: r = 0.8670<br>A) <img src="https://d2lvgg3v3hfg70.cloudfront.net/TB5647/.jpg" alt="r =
Q44: The following regression equation was found to
Q45: Suppose that environmentalists monitor algae levels in