Essay
Use the data provided in the table below to answer the question. The table shows city size and annual grocery expenditures for eight families. City size is in thousands and expenditures is in hundreds of dollars.
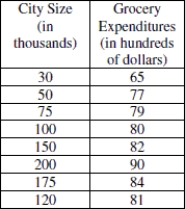
-Using the data from the table, sketch a scatterplot (by hand or with the aid of technology)of the data. Describe any association that you see. Would it be appropriate to fit a linear model to this data?
Correct Answer:

Verified
The scatterplot shows a positi...View Answer
Unlock this answer now
Get Access to more Verified Answers free of charge
Correct Answer:
Verified
View Answer
Unlock this answer now
Get Access to more Verified Answers free of charge
Q47: Use the following information to answer the
Q48: A horticulturist conducted an experiment on 110
Q49: r = - 0.6542<br>A) <img src="https://d2lvgg3v3hfg70.cloudfront.net/TB5647/.jpg" alt="r
Q50: Use the following information to answer the
Q51: Suppose that in the Midwest, it is
Q53: A veterinarian is going to investigate whether
Q54: Doctors hypothesize that smoking cigarettes inflames the
Q55: The table shows the number of minutes
Q56: The following regression equation was found to
Q57: It is determined that a positive linear