Multiple Choice
Use the following information to answer the question. Here is a table recording the number of deaths for the top thirteen worst U.S. tornados since 1925. A histogram showing the distribution is also included.
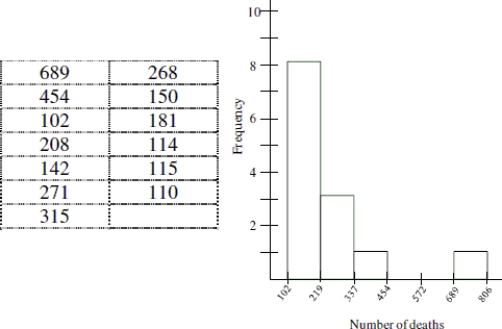
-Estimate the most appropriate measure of variability.
A) Standard Deviation; 178.5
B) Standard Deviation; 169.4
C) IQR; 156
D) IQR; 574
Correct Answer:

Verified
Correct Answer:
Verified
Q50: Below is the standard deviation for extreme
Q51: Use the following information to answer the
Q52: Use the following information for the question.
Q53: Based on the boxplot for the Midwest,
Q54: Eric is contemplating whether to accept a
Q56: Use the following information to answer the
Q57: Use the following data to answer the
Q58: The following nine values represent race finish
Q59: Use the following information to answer the
Q60: Use the following information to answer the