Multiple Choice
Use the following information to answer the question. Here is a table recording the number of deaths for the top thirteen worst U.S. tornados since 1925. A histogram showing the distribution is also included.
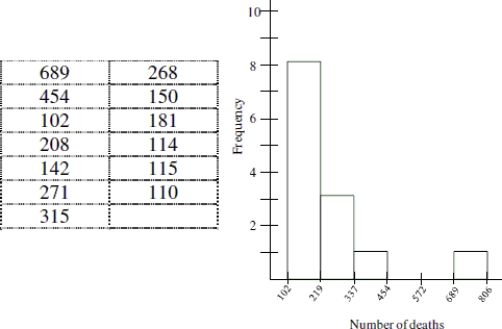
-Estimate the most appropriate measure of variability.
A) Standard Deviation; 178.5
B) IQR; 156
C) IQR; 574
D) Standard Deviation; 169.4
Correct Answer:

Verified
Correct Answer:
Verified
Q39: Use the following information to answer the
Q40: Use the following information to answer the
Q41: Use the following data to answer the
Q42: The following list shows the age at
Q43: Use the following information to answer the
Q45: Pick the statement that best describes the
Q46: A school board member says, "The typical
Q47: The following list shows the age at
Q48: Calculate the five- number summary for the
Q49: Between what two values would you expect