Multiple Choice
Data was collected on hand grip strength of adults. The histogram below summarizes the data. Which statement is true about the distribution of the data shown in the graph? 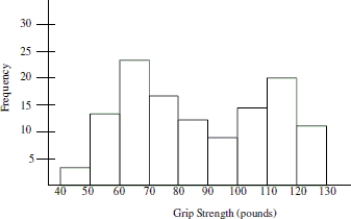
A) The graph shows evidence that two different groups may have been combined into one collection.
B) The graph is useless because it is bimodal.
C) There must have been a mistake made in data collection because the distribution should be bell- shaped.
D) The best estimate of typical grip strength is 80- 90 pounds because it is in the center of the distribution.
Correct Answer:

Verified
Correct Answer:
Verified
Q37: About what percent of girls spent 5
Q38: What is the mode response for 2001?<br>A)No
Q39: You have created a histogram showing the
Q40: What percentage of the participants had a
Q41: The histograms below show the distribution of
Q43: Based on the histogram below, would it
Q44: Which type of take- out food is
Q45: A group of junior high athletes was
Q46: About how many of the swim courses
Q47: Write a sentence to compare color preferences