Multiple Choice
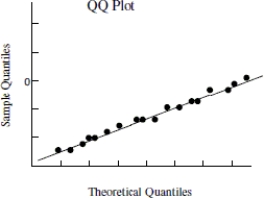
Use the following information to answer the question. Below is the scatterplot showing the association between raw material (in tons) put into an injection molding machine each day (x) , and the amount of scrap plastic (in tons) that is collected from the machine every 4 weeks (y) . The residual plot of the data is also shown along with a QQ plot of the residuals.
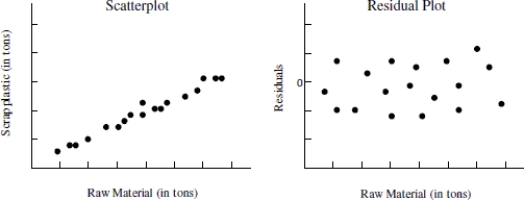
-Choose the statement that best describes whether the condition for constant standard deviation does or does not hold for the linear regression model.
A) The scatter plot shows a linear trend-- the scatter plot is not consistent with the claim of constant standard deviation.
B) The QQ plot mostly follows a straight line-- the QQ plot is consistent with the claim of constant standard deviation.
C) The residual plot shows no trend-- the residual plot is not consistent with the claim of constant standard deviation.
D) The residual plot does not display a fan shape-- the residual plot is consistent with the claim of constant standard deviation.
Correct Answer:

Verified
Correct Answer:
Verified
Q3: Explain how a residual plot can be
Q6: Explain the difference between confidence intervals and
Q15: Use the following information to answer the
Q16: Which of the following statements is not
Q17: Suppose that you were presented with data
Q20: The regression output below is the result
Q21: Which of the following is not true
Q22: Use the following information to answer the
Q23: Use the following information to answer the
Q24: Test the hypothesis that the slope is