Multiple Choice
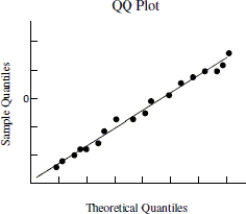
Use the following information to answer the question. Below is the scatterplot showing the association between miles driven in a semi truck (x) , and the amount of tread wear on the tires (y) . The residual plot of the data is also shown along with a QQ plot of the residuals.
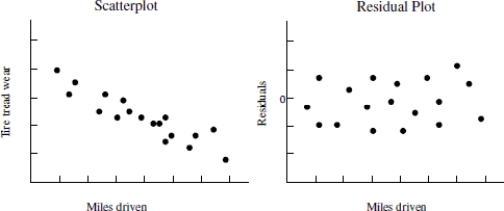
-Based on the plots provided, choose the statement that best describes whether the condition for constant standard deviation does or does not hold for the linear regression model.
A) The residual plot does not display a fan shape-- the residual plot is consistent with the claim of constant standard deviation.
B) The scatterplot shows a linear trend-- the scatterplot is not consistent with the claim of constant standard deviation.
C) The QQ plot mostly follows a straight line-- the QQ plot is consistent with the claim of constant standard deviation.
D) The residual plot shows no trend-- the residual plot is not consistent with the claim of constant standard deviation.
Correct Answer:

Verified
Correct Answer:
Verified
Q30: Use the following information to answer the
Q31: Explain what residuals are. Where do residuals
Q32: Environmental biologists studying the relationship between the
Q33: Use the following information to answer the
Q34: Use the following information to answer the
Q36: Which of the following is not a
Q37: Use the following information to answer the
Q38: Use the following information to answer the
Q39: Use the following information to answer the
Q40: Use the following information to answer the