Essay
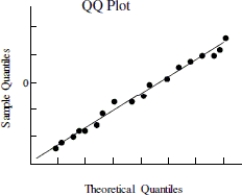
Use the following information to answer the question. Below is the scatterplot showing the association between the number of workers on an assembly team (x), and the number of parts assembled in an 8- hour shift (y). The residual plot of the data is also shown along with a QQ plot of the residuals.
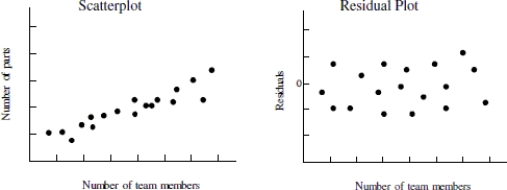
-Use the plot(s)above to explain whether the condition for linearity is satisfied.
Correct Answer:

Verified
The residual plot sh...View Answer
Unlock this answer now
Get Access to more Verified Answers free of charge
Correct Answer:
Verified
View Answer
Unlock this answer now
Get Access to more Verified Answers free of charge
Q1: Choose the statement(s)that are not true about
Q2: Use the following information to answer the
Q3: Use the following information to answer the
Q4: Use the following information to answer the
Q4: Consider the following statement: "When the conditions
Q5: Use the following information to answer the
Q7: The regression output below is the result
Q8: Suppose that you were presented with data
Q9: Which of the following statements is not
Q10: Which of the following statements is not