Multiple Choice
Which of the following QQ plots most closely depicts data from a normally distributed population?
A) 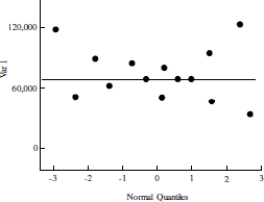
B) 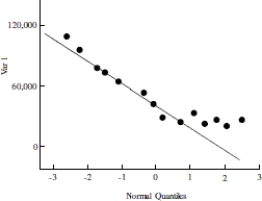
C) 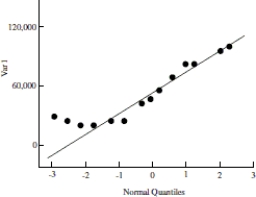
D) 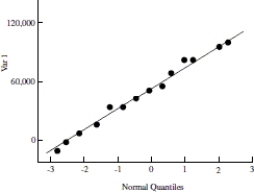
Correct Answer:

Verified
Correct Answer:
Verified
Related Questions
Q14: List three of the five conditions, pertaining
Q15: Use the following information to answer the
Q18: Use the following information to answer the
Q19: Use the following information to answer the
Q21: Use the histogram to roughly estimate the
Q22: Suppose you are asked to analyze sample
Q22: Which of the following is an indication
Q23: You are presented with data from two
Q24: State the null and alternative hypothesis to
Q25: Which of the following statements could be