Multiple Choice
Which of the following QQ plots most closely depicts data from a skewed population?
A) 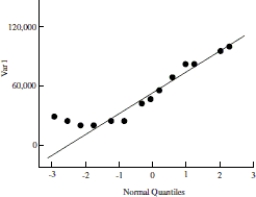
B) 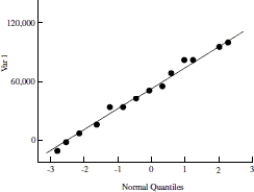
C) 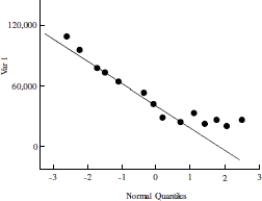
D) 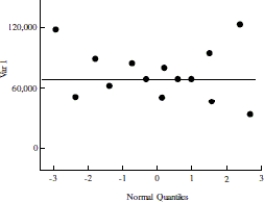
Correct Answer:

Verified
Correct Answer:
Verified
Related Questions
Q27: In the context of nonparametric inference, what
Q28: Which of the following statements is not
Q30: Use the following information to answer the
Q31: Which of the following statements could be
Q33: Use the following information to answer the
Q34: Use the following information to answer the
Q35: Find the mean, median, and geometric mean
Q36: Suppose data was collected from ten women
Q37: Use the following information to answer the
Q46: Use the following information to answer the