Multiple Choice
The table below shows the gender and the percentage of each gender that spent different amounts at a local toy store. The data was taken from a random sample of single shoppers collected over five consecutive Saturdays at the toy store. Choose the reason(s) why you cannot do a chi- square test with this data. 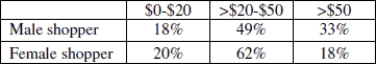
A) There is not enough information to convert the percentages to counts.
B) The samples were not collected randomly.
C) The data are from the entire population, not a sample, so inference is unnecessary.
D) All of these.
Correct Answer:

Verified
Correct Answer:
Verified
Q1: Use the following table to answer the
Q2: Use the following information to answer the
Q3: Suppose a random sample of 1,220 U.S.
Q4: The following table shows the results from
Q6: Suppose a study was conducted to see
Q7: Use the following information to answer the
Q8: Suppose a researcher was interested in learning
Q9: Suppose a random sample of 1,220 U.S.
Q10: Use the following information to answer the
Q34: Suppose a researcher was interested in learning