Short Answer
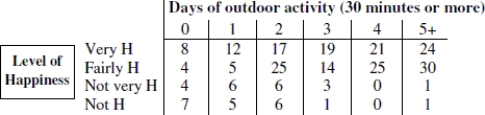
Use the following information to answer the question. The data in the top row of the table shows the number of days for which the respondent participated in an outdoor activity for at least thirty minutes in the previous 60 days. The respondents also reported their level of happiness; Very H means very happy, and so on.
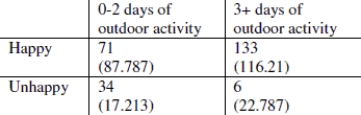
-The following table shows the data after merging categories so that there are two column categories (0- 2 days of outdoor activity of at least thirty minutes and 3 or more days of outdoor activity of at least thirty minutes), and two row categories (happy and unhappy). Expected values for each cell are also shown in parenthesis. Test the hypothesis that there is an association between happiness and with level of daily outdoor activity in the last 60 days, using a significance level of 0.05. State the value of the test statistic rounded to two decimal places, state whether the p- value is closer to zero or one.
Correct Answer:

Verified
ç2 = 34.37; ...View Answer
Unlock this answer now
Get Access to more Verified Answers free of charge
Correct Answer:
Verified
View Answer
Unlock this answer now
Get Access to more Verified Answers free of charge
Q12: Use the following information for following questions:.
Q17: Describe at least one advantage and one
Q19: Use the following information to answer the
Q20: Find the expected number of women who
Q22: Use the following information to answer the
Q23: Suppose a random sample of 1,220 U.S.
Q25: Use the following information to answer the
Q27: Suppose a researcher was interested in learning
Q28: Use the following information to answer the
Q29: A health foods store owner is thinking