Multiple Choice
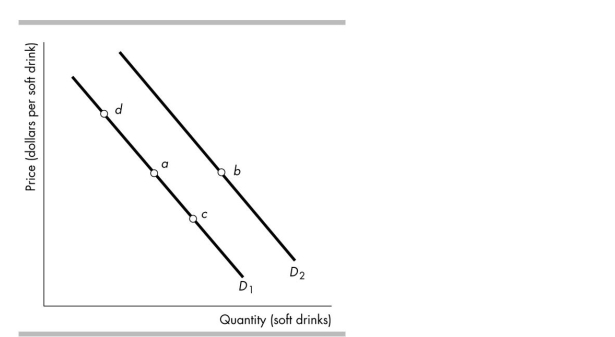
-Consider the demand curves for soft drinks shown in the figure above. Moving from point a to point c means that
A) the opportunity cost of another soft drink increases.
B) the marginal benefit of each additional soft drink falls.
C) people's incomes have decreased.
D) the price of a soft drink has increased.
Correct Answer:

Verified
Correct Answer:
Verified
Q99: Beef and leather belts are complements in
Q100: When the price of a good is<br>A)above
Q101: If both the demand and supply increase,
Q102: In a market, at the equilibrium price,<br>A)buyers
Q103: A relative price is<br>A)the number of dollars
Q105: The "law of demand" implies that demand
Q106: Leather belts and leather shoes are substitutes
Q107: If a market is NOT in equilibrium,
Q108: <img src="https://d2lvgg3v3hfg70.cloudfront.net/TB4951/.jpg" alt=" -In the above
Q109: <img src="https://d2lvgg3v3hfg70.cloudfront.net/TB4951/.jpg" alt=" -In the above