Multiple Choice
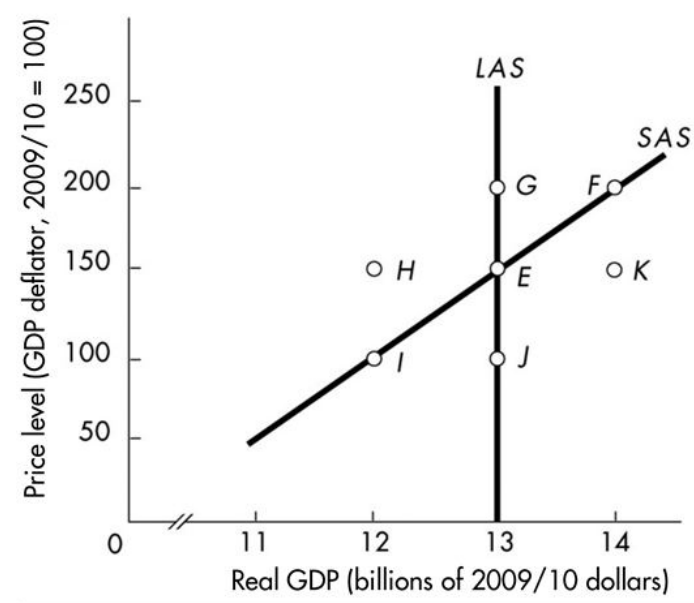
-In the above figure, which movement illustrates the impact of a constant price level and a rising money wage rate?
A) E to J
B) E to I
C) E to H
D) E to F
Correct Answer:

Verified
Correct Answer:
Verified
Related Questions
Q34: <img src="https://d2lvgg3v3hfg70.cloudfront.net/TB4951/.jpg" alt=" -In the figure
Q35: The AD curve slopes<br>A)upward due to the
Q36: Moving upward along the SAS results in
Q37: The short- run aggregate supply curve shifts
Q38: The SAS curve shifts if there is
Q40: There are several reasons why the aggregate
Q41: The country of Stanley is at an
Q42: If the money wage and other resource
Q43: <img src="https://d2lvgg3v3hfg70.cloudfront.net/TB4951/.jpg" alt=" -In the figure
Q44: When the price level rises, the long-run