Multiple Choice
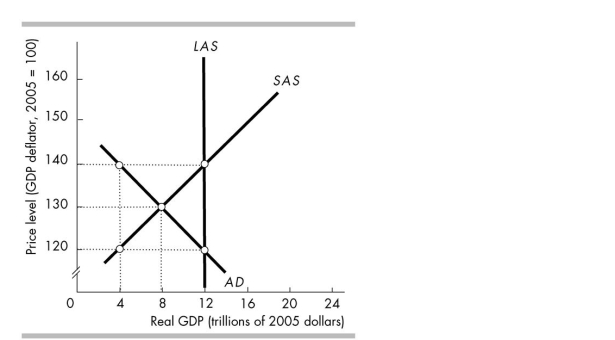
-The data in the above figure indicate that the economy will be in a long- run macroeconomic equilibrium at a price level of
A) 100.
B) 120.
C) 130.
D) 140.
Correct Answer:

Verified
Correct Answer:
Verified
Q71: In the short run, an increase
Q73: Which of the following shifts the aggregate
Q74: <img src="https://d2lvgg3v3hfg70.cloudfront.net/TB4951/.jpg" alt=" -The above figure
Q75: For movements along the long- run aggregate
Q78: In the macroeconomic short run,<br>A)actual real GDP
Q79: Which of the following increases aggregate demand?<br>A)An
Q80: When the prices of Australian- produced goods
Q81: The supply of real GDP is a
Q103: <img src="https://d2lvgg3v3hfg70.cloudfront.net/TB8586/.jpg" alt=" -In the above
Q264: <img src="https://d2lvgg3v3hfg70.cloudfront.net/TB8586/.jpg" alt=" -In the above