Multiple Choice
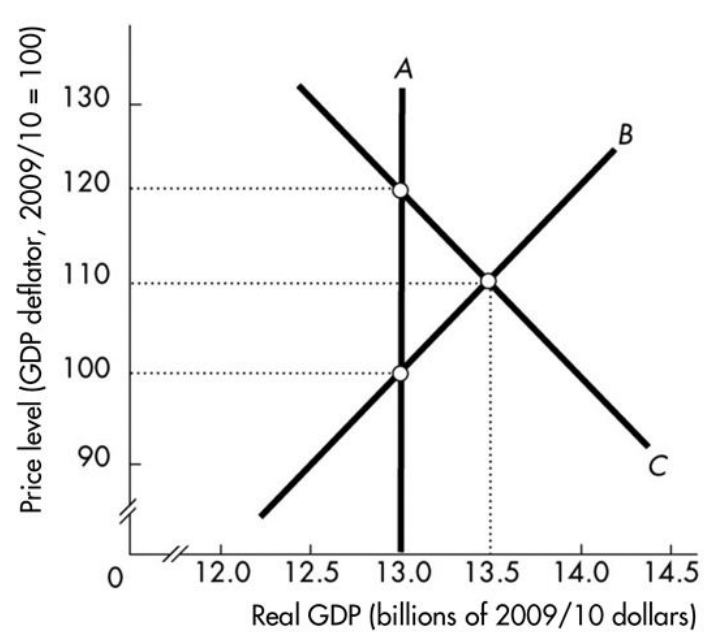
-In the above figure, curve A is the ________ curve, curve B is the ________ curve, and curve C is the________ curve.
A) short- run aggregate supply; long- run aggregate supply; aggregate demand
B) long- run aggregate supply; aggregate demand; short- run aggregate supply
C) long- run aggregate supply; short- run aggregate supply; aggregate demand
D) aggregate demand; short- run aggregate supply; long- run aggregate supply
Correct Answer:

Verified
Correct Answer:
Verified
Q47: <img src="https://d2lvgg3v3hfg70.cloudfront.net/TB4951/.jpg" alt=" -In the above
Q48: <img src="https://d2lvgg3v3hfg70.cloudfront.net/TB4951/.jpg" alt=" -In the above
Q49: <img src="https://d2lvgg3v3hfg70.cloudfront.net/TB4951/.jpg" alt=" -In the figure
Q50: <img src="https://d2lvgg3v3hfg70.cloudfront.net/TB4951/.jpg" alt=" -In the above
Q51: <img src="https://d2lvgg3v3hfg70.cloudfront.net/TB4951/.jpg" alt=" -In the above
Q53: A Keynesian economist believes that<br>A)the economy is
Q54: A change in _ creates a movement
Q55: An increase in the amount of human
Q56: Which of the following changes while moving
Q57: In a short- run macroeconomic equilibrium, potential