menu-iconExamlexExamLexServices

Discover

Ask a Question
  1. All Topics
  2. Topic
    Business
  3. Study Set
    Macroeconomics Study Set 46
  4. Exam
    Exam 24: Aggregate Demand and Aggregate Supply
  5. Question
    -In the Above Figure, the Short- Run Aggregate Supply Curve
Solved

-In the Above Figure, the Short- Run Aggregate Supply Curve

Question 108

Question 108

Multiple Choice

  -In the above figure, the short- run aggregate supply curve is SAS<sub>1</sub>. If the prices of resources fall, there is A) a shift to SAS<sub>0</sub>. B) a shift to SAS<sub>2</sub>. C) an upward movement along SAS<sub>1</sub>. D) a downward movement along SAS<sub>1</sub>.
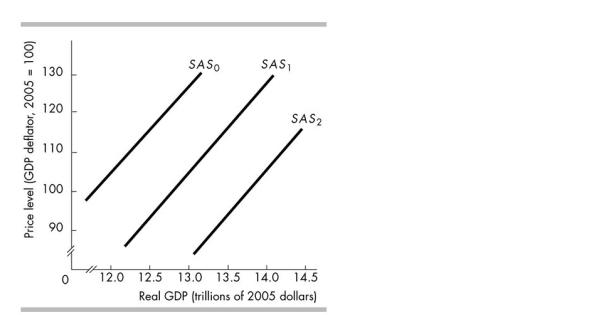
-In the above figure, the short- run aggregate supply curve is SAS1. If the prices of resources fall, there is


A) a shift to SAS0.
B) a shift to SAS2.
C) an upward movement along SAS1.
D) a downward movement along SAS1.

Correct Answer:

verifed

Verified

Unlock this answer now
Get Access to more Verified Answers free of charge

Related Questions

Q103: For movements along the short- run aggregate

Q104: In a long- run equilibrium, an increase

Q105: Inflation occurs over time as a result

Q106: The SAS curve and the LAS curve<br>A)intersect

Q107: The positive relationship between short- run aggregate

Q109: According to the intertemporal substitution effect, a

Q112: Suppose the Australian exchange rate falls from

Q113: If the full- employment quantity of labour

Q319: As the price level falls and other

Q362: At long- run macroeconomic equilibrium, .<br>A) real

Examlex

ExamLex

About UsContact UsPerks CenterHomeschoolingTest Prep

Work With Us

Campus RepresentativeInfluencers

Links

FaqPricingChrome Extension

Download The App

Get App StoreGet Google Play

Policies

Privacy PolicyTerms of ServiceHonor CodeCommunity Guidelines

Scan To Download

qr-code

Copyright © (2025) ExamLex LLC.

Privacy PolicyTerms Of ServiceHonor CodeCommunity Guidelines