Multiple Choice
Show the graph of  when k is a positive number larger than 1.
A) 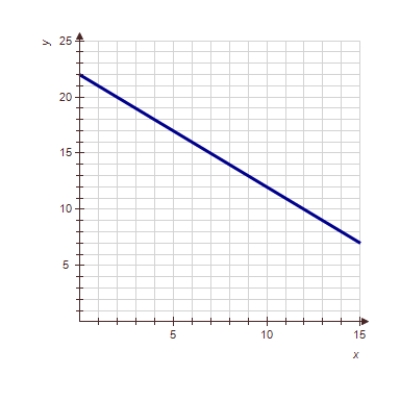
B) 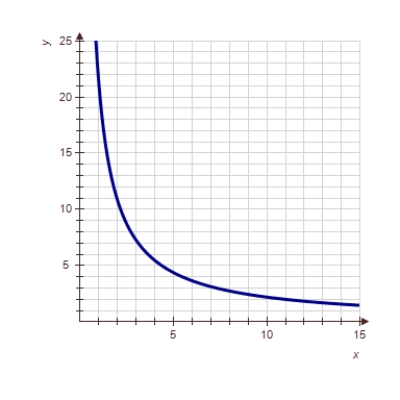
C) 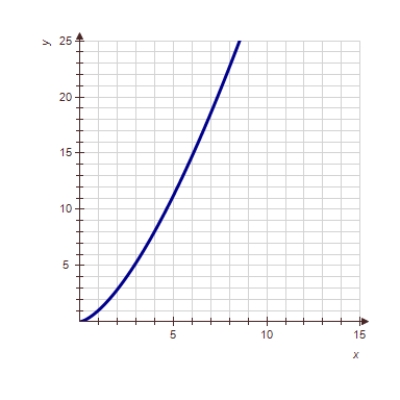
D) 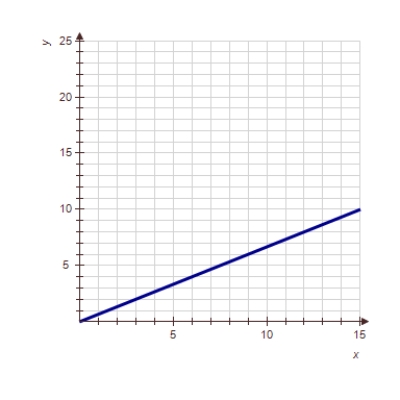
Correct Answer:

Verified
Correct Answer:
Verified
Related Questions
Q24: The life expectancy of a star is
Q25: The life expectancy of a star is
Q26: Let <img src="https://d2lvgg3v3hfg70.cloudfront.net/TB7296/.jpg" alt="Let .If
Q27: The body surface area B of an
Q28: The life expectancy of a star is
Q30: Let <img src="https://d2lvgg3v3hfg70.cloudfront.net/TB7296/.jpg" alt="Let .If
Q31: Let <img src="https://d2lvgg3v3hfg70.cloudfront.net/TB7296/.jpg" alt="Let .If
Q32: If k is negative, then the power
Q33: The weight of a certain type of
Q34: The homogeneity property applies to both power