Multiple Choice
A function shows constant percentage decay.Which of the following may be the graph of this function?
A) 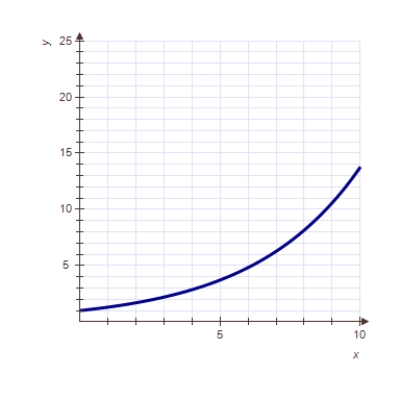
B) 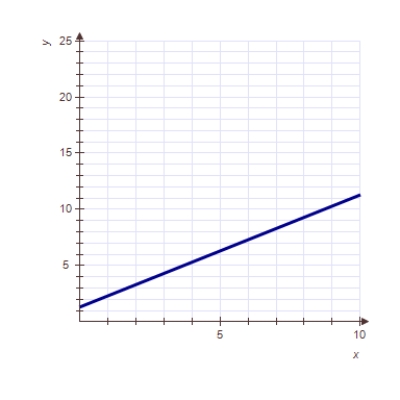
C) 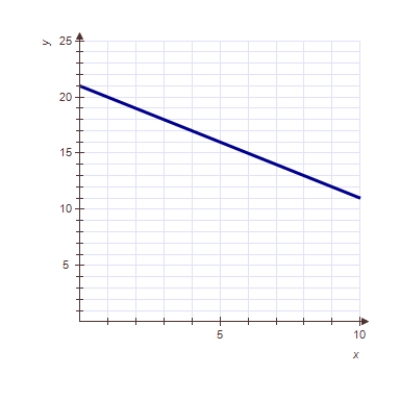
D) 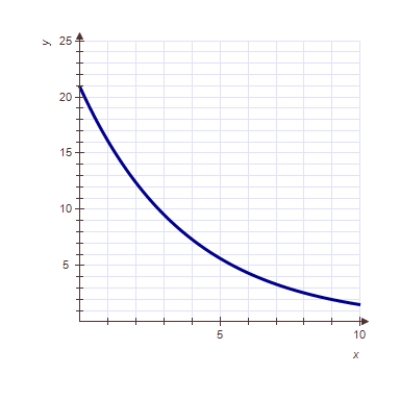
Correct Answer:

Verified
Correct Answer:
Verified
Related Questions
Q1: A population N declines by 7% each
Q3: A radioactive substance is decaying at a
Q4: The monthly percentage decay rate for a
Q5: If a function increases by 5% each
Q6: Next year's value of a certain quantity
Q7: The graph of a function that shows
Q8: If I get a 5% raise each
Q9: A function <img src="https://d2lvgg3v3hfg70.cloudfront.net/TB7296/.jpg" alt="A function
Q10: The initial value of one function is
Q11: If a function has constant percentage decrease,