Multiple Choice
The population N, in thousands, of a certain city t years after 2000 is given by 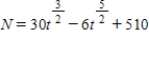 . The formula is valid over a 10-year period.Over what period was the population decreasing? A graph of N versus t can help you answer this question.
A) From 2003 to 2010
B) From 2004 to 2010
C) From 2000 to 2003
D) From 2000 to 2004
Correct Answer:

Verified
Correct Answer:
Verified
Q17: For a satellite orbiting Earth, the time
Q18: A graph of a function that is
Q19: Make the graph of <img src="https://d2lvgg3v3hfg70.cloudfront.net/TB7296/.jpg" alt="Make
Q20: The concentration D of a drug, in
Q21: The life expectancy E, in solar lifetimes,
Q23: Make the graph of <img src="https://d2lvgg3v3hfg70.cloudfront.net/TB7296/.jpg" alt="Make
Q24: Sales S, in thousands of dollars, t
Q25: Which of the following is the graph
Q26: The life expectancy E, in solar lifetimes,
Q27: Make the graph of <img src="https://d2lvgg3v3hfg70.cloudfront.net/TB7296/.jpg" alt="Make