Multiple Choice
The graph below shows the blood-glucose levels, in milligrams per deciliter, as a function of hours since a meal was ingested.The three graphs are for a healthy person (labeled normal) , a prediabetic, and a diabetic person.During the period shown on the graph, what is the shortest time since eating that glucose levels are the same for a healthy person and a prediabetic?
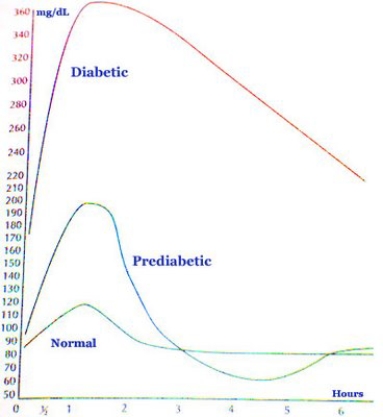
A) About 6 hours after eating
B) About 3 hours after eating
C) At about 1 hour after eating
D) None of the above
Correct Answer:

Verified
Correct Answer:
Verified
Q21: Below is a graph of a function
Q22: Inflection points may occur where a function
Q23: You put a drink in the freezer
Q24: Below is a graph of a function
Q25: Choose the answer that best completes the
Q27: The graph below shows the fundraising <img
Q28: Below is a graph of a function
Q29: Which of the following stories best fits
Q30: Below is a graph of a function
Q31: Choose the answer that best completes the