Multiple Choice
According to the data presented in the graph, between 1960 and 2000, CO 2 levels rose approximately__________ ppm. 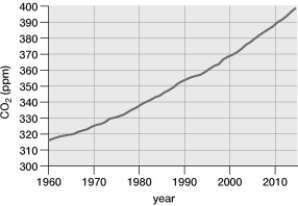
A) 320
B) 50
C) 370
D) 20
E) 70
Correct Answer:

Verified
Correct Answer:
Verified
Related Questions
Q22: Phosphorus, which is often a limiting nutrient
Q23: If a fox eats a rodent that
Q24: Burning coal and oil to release energy
Q25: The community of detritivores, such as earthworms,
Q26: The amount of energy lost as it
Q28: The hydrologic cycle is different from other
Q29: Why is acid rain or acid deposition
Q30: If the plants in a community produce
Q31: What are the most basic components of
Q32: Why is it so hard to make