Multiple Choice
This graph, which is based on estimates from the International Panel on Climate Change (IPCC) , shows that by 2100, global temperatures may rise as much as __________above average levels in 2000. The dashed data line represents a high growth of greenhouse gas, the dotted data line represents a moderate growth of greenhouse gas, and the square data line represents a substantially reduced growth of greenhouse gas. 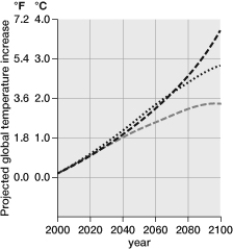
A) 3°C
B) 2.5°C
C) nearly 4°C
D) 1°C
E) nearly 2°C
Correct Answer:

Verified
Correct Answer:
Verified
Q45: The atoms that make up the molecules
Q46: Organisms that produce their own food in
Q47: Sulfur dioxide is a natural product of
Q48: Many climatologists blame the recent extremes in
Q49: In an area with nitrogen-poor soil, legumes
Q51: Aquifers are underground reservoirs in the hydrologic
Q52: Autotrophs gain energy from<br>A) omnivores.<br>B) secondary producers.<br>C)
Q53: One of the basic principles of ecosystems
Q54: Herbivores occupy the trophic level of_ consumer.
Q55: Ornithologists have noted that Mexican Jays in