Multiple Choice
The population shown in the graph is demonstrating 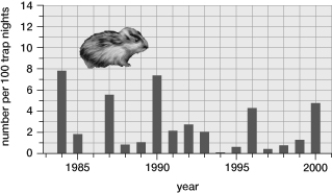
A) a typical boom-and-bust pattern.
B) clumped distribution.
C) exponential growth.
D) logistic population growth.
E) an S-curve growth pattern.
Correct Answer:

Verified
Correct Answer:
Verified
Q73: Environmental resistance is<br>A) a factor that decreases
Q74: <img src="https://d2lvgg3v3hfg70.cloudfront.net/TB1444/.jpg" alt=" -According to the
Q75: The study of how organisms interact with
Q76: Some predators feed primarily on the most
Q77: In a population of lemmings, a sudden
Q79: Which factor does NOT influence the size
Q80: A J-curve is typical of a stable
Q81: What might cause a uniform population distribution?<br>A)
Q82: The collective human ecological footprint is now
Q83: To determine the number of individuals added