Multiple Choice
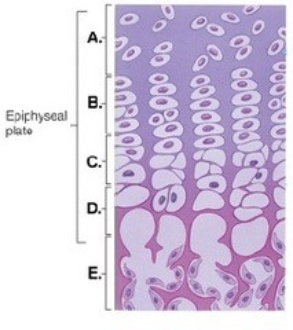
-This figure illustrates bone growth in length at the epiphyseal plate. Zone "A" represents
A) bone tissue of the diaphysis.
B) the zone of calcification.
C) the zone of hypertrophy.
D) the zone of proliferation.
E) the zone of resting cartilage.
Correct Answer:

Verified
Correct Answer:
Verified
Related Questions
Q34: The growth spurt seen in puberty is
Q35: A connective tissue sheath around cartilage is
Q36: Which of the following statements regarding PTH
Q37: A young woman is in a car
Q38: The epiphysis of the clavicle is formed
Q40: Ossification that involves replacing cartilage with bone
Q41: Which type of bone tissue is considered
Q42: The connective tissue sheath of cartilage is
Q43: The stem cells of osteoclasts are _.<br>A)
Q44: Which of the following matrix molecules in