Multiple Choice
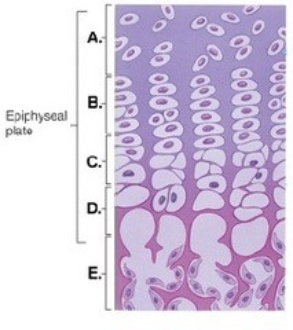
-This figure illustrates bone growth in length at the epiphyseal plate. Zone "B" represents
A) bone tissue of the diaphysis.
B) zone of calcification.
C) zone of hypertrophy.
D) zone of proliferation.
E) zone of resting cartilage.
Correct Answer:

Verified
Correct Answer:
Verified
Related Questions
Q23: Bone formation associated with cartilage is called
Q24: An x-ray determines that Peter fractured the
Q25: When blood calcium levels are low<br>A) ostoclast
Q26: Which effect can be attributed to increased
Q27: Some marrow of long bones is termed
Q29: The ethmoid and sphenoid bones are formed
Q30: Which of the following is associated with
Q31: Appositional growth deposits a new layer of
Q32: Which type of bone cell lies in
Q33: The locations where ossification begin in intramembranous