Multiple Choice
Review this Excel spreadsheet: 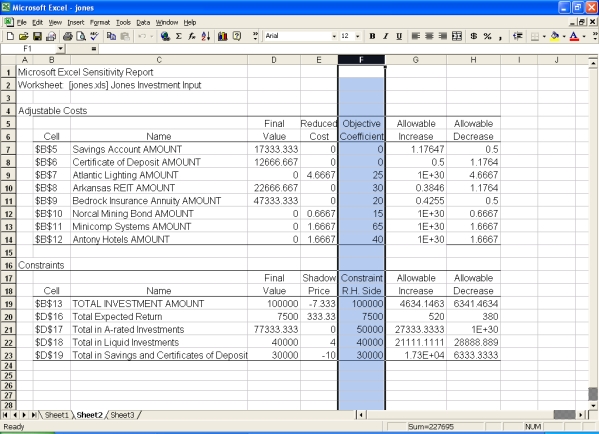 Based on the figures in the spreadsheet, we can conclude:
A) Atlantic Lighting is included in the optimal result.
B) Atlantic Lighting would be included in the optimal result if its objective coefficient were 20.333.
C) The range of optimality for Bedrock Insurance is 19.57 to 20.5.
D) The range of feasibility for the total expected return is 6980 to 7880.
Correct Answer:

Verified
Correct Answer:
Verified
Q6: For the Eastern Engineering problem in question
Q7: A maximization integer linear model is solved
Q8: Nike may build a factory at
Q9: Adding a constraint increases the time needed
Q10: You are currently paying $12 per hour
Q12: Review the Excel spreadsheet below. <img src="https://d2lvgg3v3hfg70.cloudfront.net/TB7503/.jpg"
Q13: Silver's Gym offers Kickboxing I, Kickboxing
Q14: Marc Leaser, who has a PhD from
Q15: Kings Department Store has 625 rubies, 800
Q16: Hong Securities has $300,000 to invest