Multiple Choice
Figure 8-1 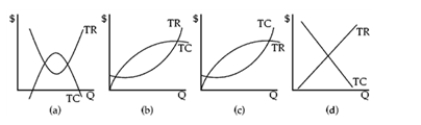
-Which graph in Figure 8-1 shows a typical firm's total revenue and total cost curves?
A) (a)
B) (b)
C) (c)
D) (d)
Correct Answer:

Verified
Correct Answer:
Verified
Related Questions
Q197: Total profit is maximized<br>A)where the difference between
Q198: Profit maximization is<br>A)the only motive of any
Q199: A firm has $200,000 to spend on
Q200: A firm's total revenue is simply the
Q201: Anna is a tax accountant and she
Q203: According to the text, when management selects
Q204: Profit can be maximized only where marginal
Q205: A firm should keep producing output as
Q206: Ski resorts have begun to offer activities
Q227: The typical total profit graphical presentation is