Multiple Choice
Figure 8-3 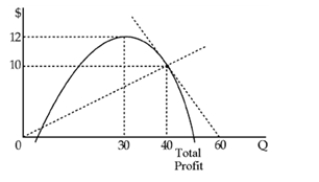
-A company draws its total cost curve and total revenue curve on the same graph.If the firm wishes to maximize profits, it will select the output at which the
A) vertical distance between the two curves is greatest.
B) total cost curve cuts the total revenue curve.
C) horizontal distance between the two curves is greatest.
D) slope of the total revenue curve is greatest.
Correct Answer:

Verified
Correct Answer:
Verified
Q217: A cellphone maker sells 6,000 units per
Q218: The marginal cost of Alexa's Guide to
Q219: When a firm's fixed cost increases,<br>A)the firm
Q220: Figure 8-5 <img src="https://d2lvgg3v3hfg70.cloudfront.net/TB8592/.jpg" alt="Figure 8-5
Q221: Firms can make decisions using marginal analysis
Q223: A separate average revenue curve is not
Q224: Total profit<br>A)is the difference between sales revenue
Q225: To find its profit-maximizing output level, a
Q226: <img src="https://d2lvgg3v3hfg70.cloudfront.net/TB8592/.jpg" alt=" -At
Q227: The typical total profit graphical presentation is