Multiple Choice
Figure 7-5 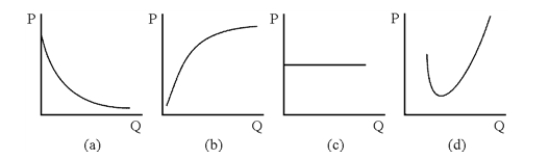
-Which of the curves in Figure 7-5 could be a firm's average fixed cost curve?
A) (a)
B) (b)
C) (c)
D) (d)
Correct Answer:

Verified
Correct Answer:
Verified
Related Questions
Q145: The long-run average cost curve shows the
Q146: Total physical product is maximized if marginal
Q147: The case of production with a single
Q148: In a bakery for a given amount
Q149: <img src="https://d2lvgg3v3hfg70.cloudfront.net/TB8592/.jpg" alt=" -A total product
Q151: Marginal revenue product is the effect of
Q152: If on a given product indifference curve,
Q153: When economies of scale are present,<br>A)costs per
Q154: Figure 7-17 <img src="https://d2lvgg3v3hfg70.cloudfront.net/TB8592/.jpg" alt="Figure 7-17
Q155: For most firms, if the marginal cost