Multiple Choice
Figure 4-12
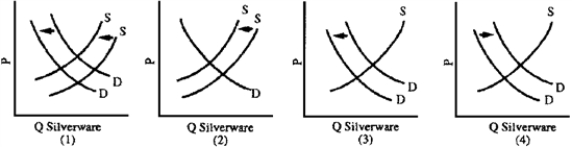
-The silverware industry has been in serious decline since the 1980s.Family dining habits are less formal so people purchase less silverware.Also, in 2006-2008, the price of silver increased from $5 to $20 per ounce.Which graph in Figure 4-12 best illustrates these developments?
A) 1
B) 2
C) 3
D) 4
Correct Answer:

Verified
Correct Answer:
Verified
Q157: The following price-quantity coordinates for gold used
Q183: A change in the price of a
Q183: A severe freeze has once again damaged
Q184: Regulations are sometimes used to "correct" the
Q189: Economists generally recognize that rent controls cause
Q190: When there is an increase in demand,<br>A)the
Q191: Normally, to the extent that a governmental
Q193: At an equilibrium price for gasoline,<br>A)everyone with
Q287: Very few societies have used price controls.
Q294: A price ceiling is only effective if