Multiple Choice
In the following graph, at point W (and ignoring the negative signs) , the marginal rate of transformation (MRT) in production __________ the marginal rate of substitution (MRS) in consumption.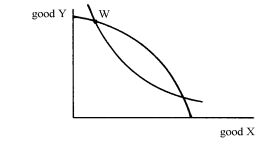
A) is greater than
B) is equal to
C) is less than
D) has no determinate relationship to
Correct Answer:

Verified
Correct Answer:
Verified
Q15: Given the production-possibilities-frontier/community-indifference-curve diagram below,Where P is
Q16: In the diagram in Question #16 above,
Q17: "In a situation of increasing opportunity costs,
Q18: If country A's (P<sub>X</sub>/P<sub>Y</sub>) in autarky is
Q19: If a country's P<sub>X</sub>/P<sub>Y</sub> in autarky is
Q21: If two countries have identical production-possibilities frontiers
Q22: Given the diagram below, which shows country
Q23: (a) Using the neoclassical model, build the
Q24: Explain, using the PPF-indifference curve diagram, how
Q25: As a country moves from autarky to