Multiple Choice
The curve in the following diagram is called an __________, and its slope (ignoring the Negative sign) indicates the ratio __________.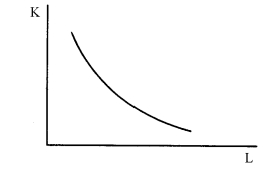
A) . isoquant; w/r
B) isoquant; MPPL/MPPK
C) isocost line; w/r
D) isocost line; MPPL/MPPK
Correct Answer:

Verified
Correct Answer:
Verified
Q10: Suppose that, from an initial individual consumer
Q11: The equilibrium condition for consumer behavior pertaining
Q12: In the following table of production
Q13: In the Edgeworth box diagram in production
Q14: Explain why any point on an economy's
Q16: Explain, using the isoquant-isocost diagram, why a
Q17: A production isoquant shows the various combinations<br>A)
Q18: In the Edgeworth box diagram for production,<br>A)
Q19: You are given the following two possible
Q20: In the diagram in Question #7 above,