Multiple Choice
The graph shown below depicts the hormonal changes that occur during the female reproductive cycle. Day one on this graph represents the onset of menses. Based on what you know about the events induced by the hormones shown in the graph, on what day would you predict that ovulation would occur? 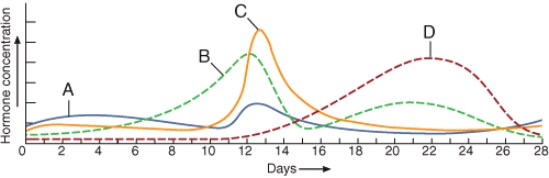
A) Day 1
B) Day 6
C) Day 12
D) Day 14
E) Day 26
Correct Answer:

Verified
Correct Answer:
Verified
Q45: The average length of the menstrual cycle
Q46: The region between the labia minora is
Q47: During spermatogenesis, the cells formed by meiosis
Q48: The dome-shaped portion of the uterus found
Q49: All the following hormones are released by
Q51: The average volume of semen in a
Q52: The steps in sperm maturation that result
Q53: The process that results in release of
Q54: Gametes differ from all other body cells
Q55: All of the following are true about