Multiple Choice
Which of the following sections of the bar graphs shown in the diagram would increase the most in an obese individual? 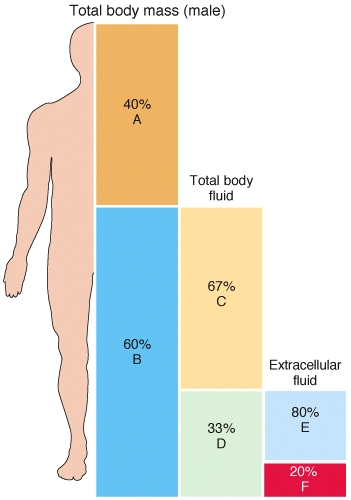
A) A
B) B
C) C
D) D
E) E
Correct Answer:

Verified
Correct Answer:
Verified
Related Questions
Q71: Which of the following hormones stimulates increased
Q72: Changes in the breathing rate can be
Q73: Sodium is a strong acid that can
Q74: Water is lost from the body through
Q75: All of the following are characteristics of
Q76: Using hypoventilation or hyperventilation to help balance
Q77: Blood plasma is a component of<br>A)intracellular fluid<br>B)extracellular
Q78: Osmotic pressure of body fluids plays an
Q79: Which of the labeled sets of bars
Q81: The most abundant cation in extracellular fluid