Multiple Choice
Which diagram and picture in the figure best represents the results obtained when placing red blood cells into a hypotonic solution? 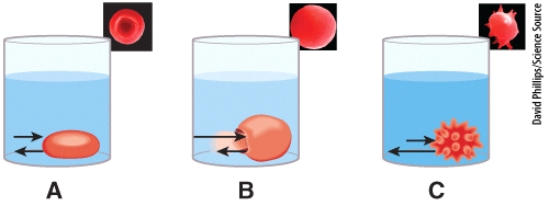
A) A
B) B
C) C
D) None of the choices is correct.
E) All of the choices are correct.
Correct Answer:

Verified
Correct Answer:
Verified
Related Questions
Q9: Which of the following intracellular structures is
Q10: Codons are located on _.
Q11: The characteristics of each individual protein are
Q12: The type of body fluid found in
Q13: Amino acids that participate in protein synthesis
Q15: Proteins loosely attached to the interior or
Q16: The two major steps in synthesis of
Q17: The anticodon is located on the<br>A)mRNA<br>B)rRNA<br>C)tRNA<br>D)DNA<br>E)ribosome
Q18: An orderly, genetically programmed cell "death" involving
Q19: The phase of mitosis labeled B in