Multiple Choice
Which diagram and picture in the figure best represents the results obtained when placing red blood cells into a normal saline solution (0.9% NaCl) ? 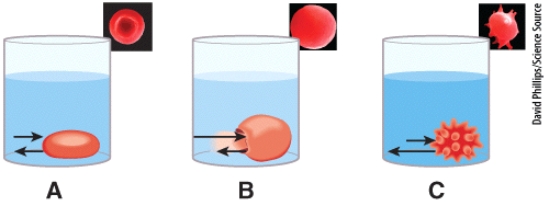
A) A
B) B
C) C
D) None of the choices is correct.
E) All of the choices are correct.
Correct Answer:

Verified
Correct Answer:
Verified
Q83: When solutes move from an area of
Q84: Pinocytosis and phagocytosis involve structural changes in
Q85: In passive transport, the net result is
Q86: The study of the processes and problems
Q87: The main functions of rRNA occur in
Q89: During interphase, a cell replicates its DNA
Q90: Which of the following statements BEST describes
Q91: The study of tumors is called<br>A)pathology<br>B)oncology<br>C)epidemiology<br>D)pharmacology<br>E)histology
Q92: Based on the structural features of the
Q93: The cellular organelle primarily responsible for transforming