True/False
The line chart below shows tomato prices each month from January (month 1) to December last year ($ per pound).By looking at this chart you can see the lowest tomato prices occurred in July. 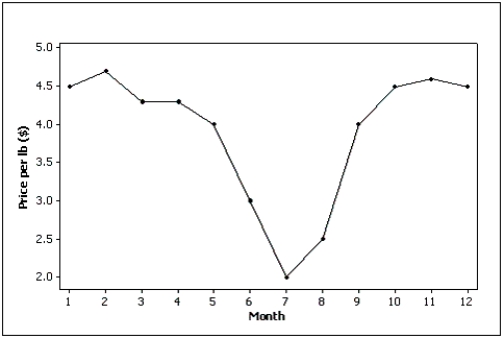
Correct Answer:

Verified
Correct Answer:
Verified
Related Questions
Q8: For what type of data is a
Q30: A professor examines the relationship between minutes
Q33: According to the stem-and-leaf plot below, the
Q37: The two most important characteristics to look
Q47: Is it fair to depict Texas as
Q64: A cumulative relative frequency distribution lists the
Q76: Which of the following is the method
Q103: Which of the following statements is true?<br>A)Graphical
Q137: One of the variables used to help
Q157: What values are displayed on a cumulative