True/False
The line chart below shows cucumber prices fluctuated from $2.00 per pound to over $4.50 per pound during the year. 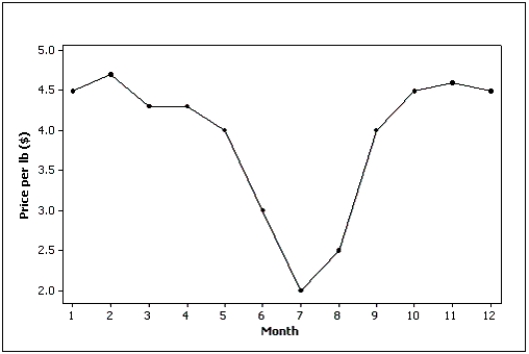
Correct Answer:

Verified
Correct Answer:
Verified
Related Questions
Q11: The number of class intervals in a
Q17: Electronics Company At a meeting of
Q21: Observations that are measured at the same
Q32: Internet Classes<br>A survey of 25 students
Q46: A pie chart uses relative frequencies to
Q52: Slopes and trends in a line chart
Q84: How do you determine whether two interval
Q109: The graphical technique used to describe the
Q146: If when one variable increases the other
Q156: The two most important characteristics revealed by