Multiple Choice
Which of the following statements describe(s) the line chart below? 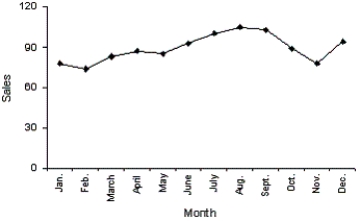
A) November experienced the lowest sales throughout the year.
B) August experienced the highest sales throughout the year.
C) Sales did not fluctuate more than 30 units on either side of 90.
D) All of these choices are true.
Correct Answer:

Verified
Correct Answer:
Verified
Q19: Home Care Data are collected on
Q20: Insurance Company A representative from a local
Q35: Explain the difference between a histogram and
Q52: Compare the spread of the two histograms
Q63: Which of the following is true about
Q88: Internet Classes<br>A survey of 25 students
Q98: Observations that are taken during successive points
Q101: The number of crimes per capita is
Q102: If the data in a scatter diagram
Q122: {Test Grades Narrative} Describe the distribution of