True/False
The scatter diagram below depicts data with a negative linear relationship. 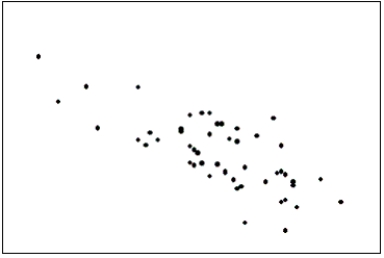
Correct Answer:

Verified
Correct Answer:
Verified
Related Questions
Q5: If we draw a straight line through
Q23: Test scores<br>The scores on a calculus
Q25: {Teachers Ages Narrative} Draw a frequency histogram
Q71: Which of the following statements about histograms
Q86: Teachers Ages<br>The ages (in years) of a
Q89: A supermarket's monthly sales (in thousands of
Q95: An economics professor wants to study the
Q121: When a distribution has more values to
Q144: In applications involving two variables,X and Y,where
Q176: Test scores<br>The scores on a calculus