Essay
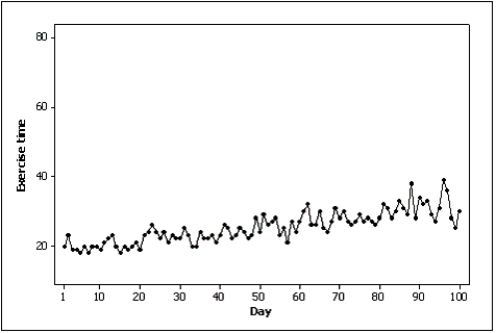
Samantha recorded her amount of exercise time (in minutes) for 100 days.Both of the line charts below were created based on her same data set.Which line chart makes her exercise times look more variable and why? 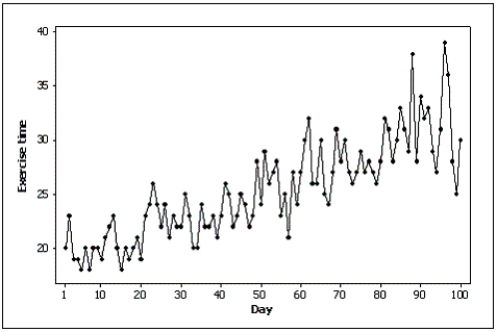
Correct Answer:

Verified
The first line chart looks mor...View Answer
Unlock this answer now
Get Access to more Verified Answers free of charge
Correct Answer:
Verified
View Answer
Unlock this answer now
Get Access to more Verified Answers free of charge
Q2: When a distribution has more values to
Q41: In order to draw a scatter diagram,we
Q62: Differences in the frequencies of a histogram
Q69: A histogram represents interval data.
Q87: Possible methods of creating distorted impressions with
Q98: The sum of cumulative relative frequencies always
Q103: Consider the following cumulative frequency distribution.<br> <img
Q105: Experience shows that few students hand in
Q127: A(n)_ is a graphical display consisting of
Q138: {Test Grade Narrative} Construct a relative frequency